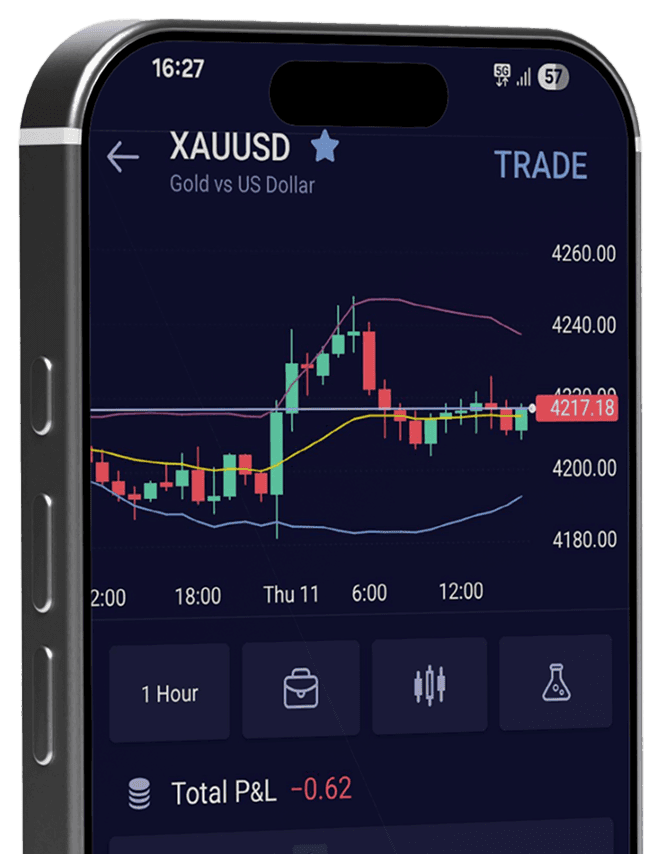
Turn Market Data into Insights
Combine market data with Trading Central’s analysis to quickly spot key levels, potential setups, and changing trends, so you can act on opportunities with greater confidence.
Trading Central Research Platform
Trading Central’s research platform is available online to all CXM clients. It delivers updated technical levels, targets, and time frames across supported assets, with technical analysis and analyst views accessible via a standalone web portal or directly in the MT4 & MT5 platform.
Powering smarter trading decisions
Trading Central analytics are available to eligible CXM clients. The solution combines seasoned analyst expertise with automated algorithms to deliver versatile investment research and technical trading analysis, and is trusted by leading global banks, hedge funds, and brokers.
Adaptive candlestick
Trading Central’s analyst opinion indicators can provide you with the direction of the trend and important technical points. With its award-winning technical analysis method, TC uses directional predictions for each chart analysis and will always support your investment decisions here.

Experts screen important information for you
CXM & Trading Central combines candle charts with unique quantification and technical analysis, focusing on related technical graphics that are helpful for investment decisions at the current stage.
Learn MoreOur featured graphics
The space TC MT4 indicator can scan any chart and find 16 commonly used and selected candle technology graphics when you need them.
Learn MoreAdaptive divergence indicator
If you like using the MACD indicator, you’ll also find the Adaptive Divergence Indicator (ADC) useful for short‑term trading. It can generate earlier signals than MACD and automatically adjusts its timing during periods of market volatility.
Fast or slow price indicator
We use a moving average as the slow indicator and a changing weighted moving average as the fast indicator. In trending markets, the fast indicator reacts more quickly than traditional moving averages, which often lag. When the fast line moves above the slow line, or price moves above the indicator, it signals an upward trend. These behaviors form the core of the Adaptive Divergence Indicator (ADC).
Learn MoreInitial and smooth signal lines
For fast signals, look for an upward slope and when the ADC initial signal line moves above the ADC smooth signal line, generating a buy signal. For slower confirmation, both lines should be above the zero line. As with MACD, the initial signal line is the difference between the fast and slow indicators, and the smooth line is an exponential moving average—however, ADC typically uses an automatic smoothing length of around 4, compared with 9 in MACD.
Learn MoreLong or short entry / exit signals
Blank labels highlight trading opportunities: (buy long), LX (exit long), (sell short), and SX (exit short). Signals are generated from all Adaptive Divergence Indicator (ADC) components—price lines, indicators, and oscillators—which can be shown in a flexible price window. Each component is independent, but you can weight them when making trading decisions.
Learn MoreOscillation factor fast and slow
The space ADC indicator uses two oscillation factors. For fast signals, look for the fast oscillation factor to slope upward and move above the zero line. For slower signals, check that the fast oscillation factor is above the slow one, or that the slow oscillation factor is sloping upward, sitting below the fast factor, and remains above the adaptive variable.
Learn MoreAnalyst perspective
Trading Central’s analyst opinion indicators can provide you with the direction of the trend and important technical points. With its award-winning technical analysis method, TC uses directional predictions for each chart analysis and will always support your investment decisions.
Key technology points to help you trade
Leave the analysis to the experts and use CXM & Trading Central’s insights to support your trades. You can clearly see our trend views, target levels, and alternative strategies, along with the turning points that signal when the view changes and where the new targets lie.
Learn More






Ready to Start Trading?
Got a cell phone, a tablet or a laptop? Build your strategy and manage your trading positions 24/7/365 wherever you may be. CXM makes trading easier for you with just a click on a button. Because trading never stops!